What is DAR?
The Dashboard, Analysis, Reporting (DAR) is a methodology. DAR is followed to be creative and meet the varying requirements of clients. In a nutshell you lead with a Dashboard page, followed by Analysis pages, and finish with Reporting pages.
Applying DAR methodology to build an application
During design of a dashboard, when applying DAR methodology following three aspects must be taken in to consideration:
•Dashboard
- Gives just the most important information
- Has the least amount of Interactivity
- Users having less time to review the status of their business
Example of Dashboard Page
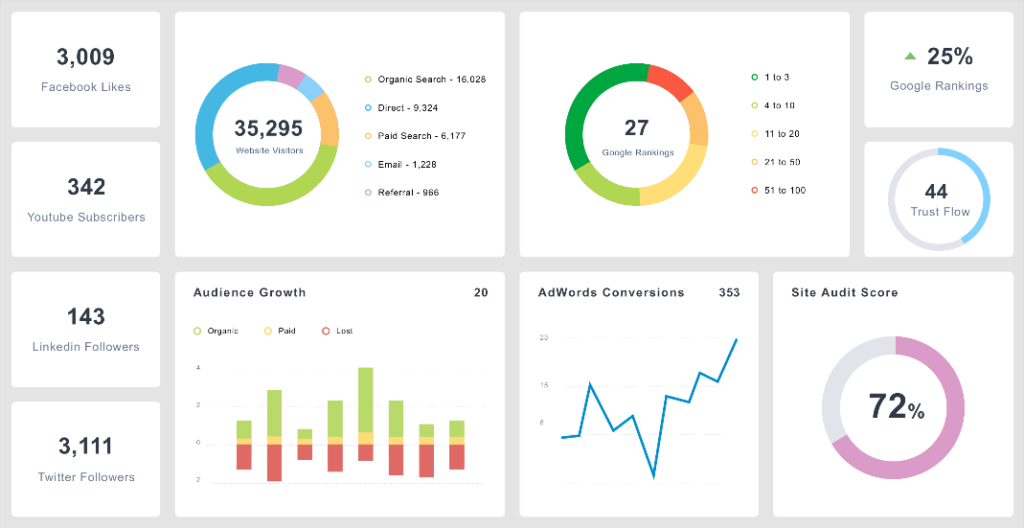
Best Practices of Dashboard Page
- Keep the information general and high level with few KPIs
- Give a few basic filtering options but not many
- Have a hierarchy to your information to make scanning easy.
- Information should be larger than your least important information.
•Analysis
- Analysis pages are more interactive
- Analysis pages are used to spend more time for deeper understanding
- For instance a page just for Comparative Analysis
Example of Analysis Page
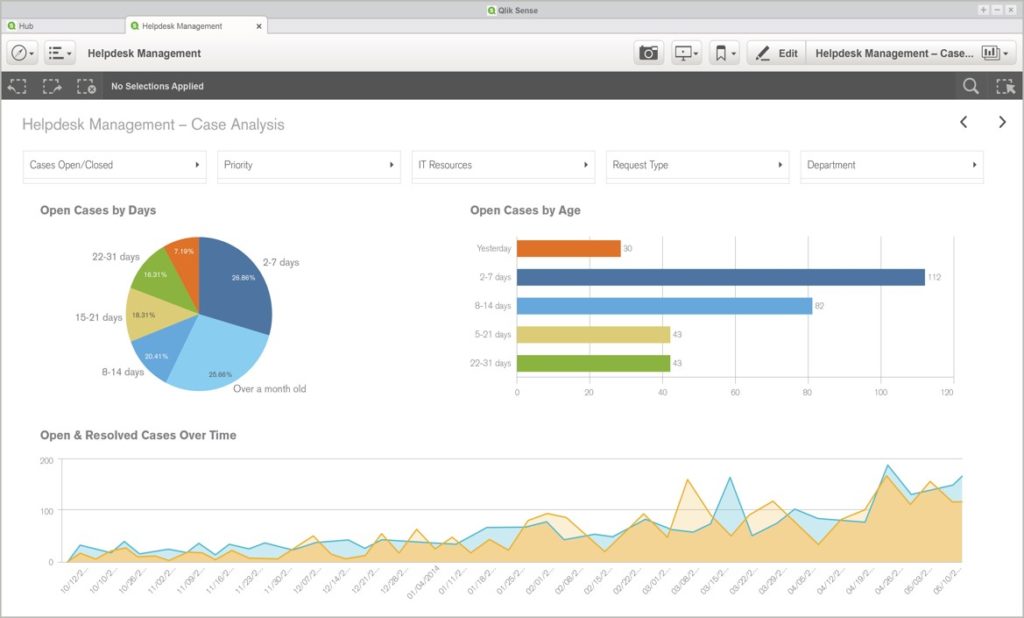
Best Practices of Analysis Page
- Introduce additional filters / list boxes
- Information of an entire page should be about a particular topic / theme
- Pages can scroll vertically
- Introduce more charts and tables
•Reporting
- Reporting pages give the most granular information with lots of tabular data
- It’s where a user can spend a lot of time sorting and filtering through the details
Example of Reporting page
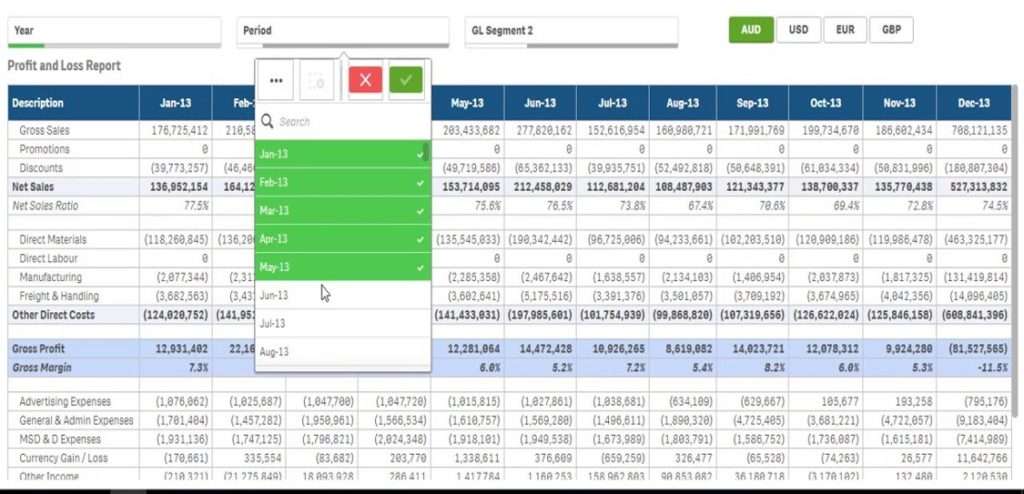
Best Practices of Reporting Page
- Give the most granular information as possible
- Give users the ability to view absolutely every detail they need to take action