QlikView What If Analysis
What if analysis is a scenario based analysis of Qlikview which enable user to visualize output in different case studies. Within QlikView you may wish to add further power to your applications by giving your users the ability to drive the analysis by variables that can be defined on the fly. For instance revenue of the company is 10 crore and a given scenarios where Interest Rate is 10%. Now you may curious to analyze what would be revenue if the Interest Rate will increase up to 15%. How it will impact to sales and revenue etc. These kind of analysis needs inputs of multiple parameter by end user at run time ti see the data differently.
What if analysis can be achieved by using two type of controls, such as Input box and Slider Object. Lets see how we can implement what if analysis using both the methods.
-
What if analysis using inputted data
Input Boxes are a useful object when you need to have analysis driven by a user defined number. For example you can base a calculation on an ad hoc number that your users can define during their analysis.
Before you create your input box, you need to create a variable that the box is based on. To do this, go to the Setting Menu, Select Variable Overview then select add. Name your new variable in the resultant box. Then select OK. You should then define the default value for the variable.
Simply type the number in the Definition box. You are now ready to add your input box. Select new sheet object by right clicking on the sheet and selecting ‘New Sheet Object’ ‘Input Box’. You will then be presented with the properties for that object. You will see your new variable in the left pane, simple select add and it will move over to the right ‘Displayed Variables’ pane. Click ok.

You now have a box that you can enter your own data. You can now base an expression/analysis on this manual variable. To do this add a simple Pivot Table (right click Add Sheet Object, Chart, select Pivot Table).

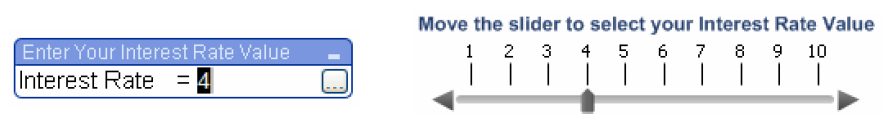
(Input Box)
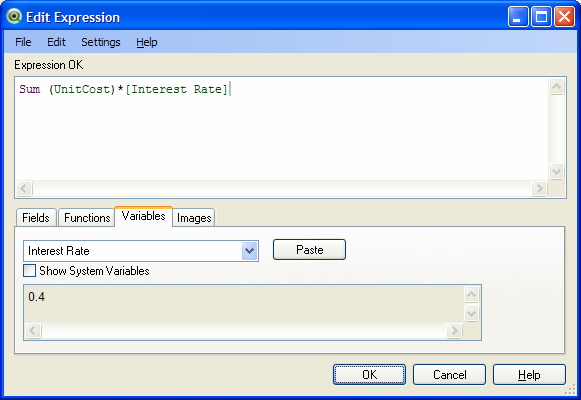
When you are selecting your expression you can now add your variable to this to create a dynamic calculation. When you add your expression to your Chart, you must then add the variable to the calculation, as below You can now change your value in your input box and pressing enter will apply this new value to your calculated expressions. Therefore impacting the values displayed in your Pivot Table.
-
What if analysis using Slider Objects
You can use the same variable creation as in the input box example above. Right click the sheet and select New Sheet Object, Slider/Calendar Object. In the resultant properties box, select the variable to be used.


(Slider object)
Select ok. You will then see a slider object appear. As in the example above for the input box, you can add the variable to your calculated expression and then use the slider to impact this data. As you have done in the example above, create a chart object to see the impact of the Slider. As you move the slider, the data in the chart (Pivot Table) will change to reflect the new (in this case) interest rate.